Categories
Leaflet maps olpc openstreetmap

Offline Solution for OpenStreetMap (OSM)

I’ve recently became involved with XSCE (School Server Community Edition) on their “Internet in a box” project to allow OpenStreetMap (OSM) maps to be available offline. Some of their deployments in remote schools around the world do not have a consistent internet access. So the idea is to download and store a set of knowledge resources (Wikipedia, videos from Khan Academy, OSM maps, etc) on a server, which will then provide those resources while being offline to laptops connected on the internal network.

Here are the constraints that need to be considered

  • The laptops that will be visualizing the maps are very underpowered. They are often XO laptops from the One Laptop per Child OLPC project.
  • The server, while not being as underpowered as the laptop, are typically quite limited as well on the HD, RAM and CPU.
  • Server handle other tasks than providing maps so this can’t be using entirely the hardware available
  • Server specs are not consistent from a deployment to the other (but they do have in common that they must run the XSCE software)
  • Deployments’ needs are rarely the same, they can be in any region of the world and each of them might not want the same level of map details for the same countries
  • Server is typically configured by a volunteer that has internet access, before it is deployed in remote locations. While they do have IT knowledge, this need to be simple enough.
  • Map does not need to be updated every week, but it needs to be relatively recent. If the server gets internet access once in a while, it needs to be able to update the maps relatively easily

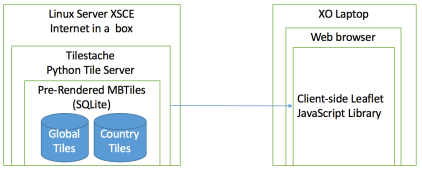
The solution chosen is shown on that architecture diagram.

Since the server specs are limited, the map tiles needs to be pre-rendered before they make it to the XSCE internet in a box server. They cannot be rendered on the fly from the native OSM solution which uses a PostgreSQL database with PostGIS because it requires too much resources and would require to provision a different database for each deployment.

The pre-rendered tiles are stored into a MBTiles file, which is a format created by Mapbox that allows to stores efficiently millions of tiles in a SQLite database (which is then stored in a single file). It is efficient because it avoids duplicate tiles, which is frequent with large area of water. This also simplifies deployment because all you have to do is to move few files around instead of potentially copying millions of PNG tiles stored directly on disk.

To allow saving previous HD disk space, there will be a global planet OSM MBtiles (that does not zoom above level 10, which only zoom up to the city level) and then each country will be available for download as a separate pre-rendered MBTiles file (for zoom level 11 to 15). So for example, if the deployment is in Nepal, they could decide to download on the server the planet MBtiles file to get the map of the whole world, and then only specifically download the higher-zoom file for Nepal, to allow to zoom up to the street level. Downloading the whole world at zoom level up to 15 would require way above 1TB of HD space, which we can’t handle. This is why we want to get a high zoom level only for the countries that are needed by the deployment and based on how much HD space they have to spare.

To serve the MBTiles on a web server, there are a few options like TileStream (node.js) and TileStache (python). I chose TileStache, because it supports composite layers, which allows to serve multiple MBtiles file at the same time. TileStream only supports serving one MBTiles at a time, which would require to merge multiple MBtiles together, which is possible, but complicates deployment and makes it harder if we want to add/remove only specific countries later on. TileStache can serve tiles on WSGI, CGI and mod_python with Apache. XSCE also happens to already run multiple tools with Python and use WSGI with another tool, so the integration was easier (click here for details on the integration).

Then all you need is a simple HTML page, that will load Leaflet as a client side javascript library and will be configured to query  the Tilestache tile server located on the local network.

This solution is entirely based on raster tiles, instead of vector tiles. While vector tiles offers significant savings in terms of disk usage, they require much more CPU usage to render on the frontend and newer browsers, which is impossible with the type of hardware that we have (XO laptops).

The big remaining question is, where are those tiles being rendered, where are they stored and how can they be downloaded on demand by the XSCE server? This is a topic for a further blog post!
Categories
Crossfilter D3 javascript Leaflet maps

Creating a data visualization tool using D3.js, Crossfilter and Leaflet

I’ve recently completed my first javascript data visualization project at The Sentinel Project for Genocide Prevention to develop a dashboard that tracks indicators of hate crime in Iran.

You can take a look here:
http://threatwiki.thesentinelproject.org/iranvisualization

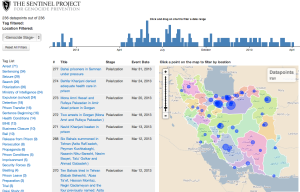
Screenshot of Threatwiki Data Visualization

Initial requirement

I had a set of data coming from a JSON REST API and I wanted to show the main data in a table, display the geographical coordinates of the data on a map and be able to filter by date and tags.

Technology choices

I chose Crossfilter to be able to filter through the data, D3.js to generate/display all the data and the map itself is created with leaflet.js

Implementation details

For the map generated with leaflet.js, I used CloudMade (which I highly recommend) to get maps from OpenStreetMaps. I added a layer on top of the map to show different regions of the country, which was coming from Natural Earth shapefiles and converted to data with TopoJson and added on the map with D3. Leaflet turned out to be a great tool that I will definitely use again, I used the D3 + Leaflet tutorial from Mike Bostock to learn how to combine the 2 tools together. To add the datapoints at specific locations on the map, I used the marker functionality of Leaflet. I started adding the datapoints manually on the map by generating the proper svg tags with D3 on the canvas but I switched to markers because this will allow me later to integrate with LeafLet Market Cluster. This Leaflet plugin gives you the possibility of combining multiple closely located points on a map, which becomes useful when you have a high concentration of points in a a small region that are hard to distinguish at the normal zoom level. This other tutorial Let’s make a map by Mike Bostock  also come handy when working with D3 and maps.

There was a good learning curve necessary to understand D3.js. Reading code from examples is not always enough, I had to read about the core concepts and the introduction available on their github wiki. However, once you understand the concept, you realize that this is a very powerful tool to generate all kind of visualization either visually (in a canvas using SVG) or just displaying a set of data as text.

To be able to filter by tags, date, and other metadata, I used Crossfilter, a open-source library developed by Square. To learn about Crossfilter, I used this excellent example on their website. I used their example code to create the visual bar chart that is used as a timeline. There is also a great tutorial on the Wealthfront Engineering blog that really helped me to understand the concepts of the library.  Crossfilter was definitely easier to grasp and understand. The most recent version of the tool, 1.2.0., released just a few days ago, is definitely necessary. They introduced the concept of filterFunction, to give you more control on how you filter your data.

For a typical filtering in Crossfilter, you only provide the object to the filter function of a chosen dimension and Crossfilter will do the filtering. You  need to implement a filter function when your data structure gets more complex. Let’s say you have a record that can have one or multiple tags. If you only filter by giving the name of a tag, you will only get back the records that contain very specifically only this 1 tag and ignore all the records that have this tag combined with other tags.

So you want to implement a filterFunction like this:

window.filter = function(tagname) {
 byTags.filterFunction(function (tag) {
  if (tag!==null && typeof(tag)!='undefined'){
   for(i=0; i<tag.length; i++) {
    if (tag[i].title==tagname){
     return true;
    }
   }
  }
  return false;
 });
}

In that case we will go through our array of tag inside the record and return true to the filter at the moment we find the matching tag inside the array, so it wouldn’t matter if we have 1 tag or 10 tags on that record.

To learn more and get involved

If you are interested to look at the code, our project is hosted on Github. You can also look directly at the visualization javascript file. The data for this project is free of access to anyone who wants it, drop me an email if you need information on that.

That visualization for The Sentinel Project for Genocide Prevention has been announced on their blog.

If you have some experience with data visualization, maps, GIS or you just are a data nerd send me an email, we have lots of interesting projects coming up!

Categories
javascript node.js

MongoDB and Node.Js Tutorial

Quick post to link to an excellent tutorial on the Heroku website to use MongoDB as a database with Node.Js using the Mongoose library.

https://devcenter.heroku.com/articles/nodejs-mongoose

This is the exact same implementation that we used to build ThreatWiki with Mongoose. Quick and fast to implement.

One thing that surprised me about this guide is that it recommends to specify the option “safe” mode for the connection with mongoDB. The safe mode is the mode that guarantees that you will be informed by an error if a write to the database fails (in the default implementation of MongoDB it’s off by default to increase speed).

However, as we can read on Mongoose documentation page:

By default this is set to true for all schemas which guarentees that any error that occurs will get reported back to our method callback.

So the safe mode is already enabled by default by mongoose for every save on the database, so it doesn’t seem necessary to specify it like the tutorial is proposing.

Categories
bootstrap javascript

Select2 javascript library with Bootstrap

I’m currently volunteering for The Sentinel Project on a genocide risk tracking and visualization platform named ThreatWiki built with node.js and mongoDB. Read more details about the launch on The Sentinel Project blog

One important feature in the frontend is the ability to add tags to datapoints created in the system. As we were testing locally in our environment, the typical multi-select input box looked like a good enough way to select tags.

Typical tag list

However after starting to import an Excel sheets that contains over 500 datapoints and over 50 different tags, it became clear that this way of selecting tags wouldn’t work well for the users. I decided to add the Select2 library that allow us to search across all the tags and will display the existing tag choices below.

Adding it to our existing codebase was very minimal work, I actually wish I did it before. My only concern was to know if it would play nice with our Bootstrap frontend framework. At first look it didn’t but adding “width: ‘resolve'” as option to select2 fixed it (see that issue on select2’s github). The result looks fantastic and easier to use by our users

Tag selection with Select2

Look at ThreatWiki on GitHub if you want to know more about the project!